Knowledge Surveys Part 2 — Twenty Years of Learning Guiding More Creative Uses

by Ed Nuhfer, California State Universities (retired)
Karl Wirth, Macalester College
Christopher Cogan, Memorial University
McKensie Kay Phillips, University of Wyoming
Matthew Rowe, University of Oklahoma

Early adopters of knowledge surveys (KSs) recognized the dual benefits of the instrument to support and assess student learning produced by a course or program. Here, we focus on a third benefit: developing students’ metacognitive awareness through self-assessment accuracy.

Communicating self-assessed competence

Initially, we just authored test and quiz questions as the KS items. After the importance of the affective domain became more accepted, we began stressing affect’s role in learning and self-assessment by writing each knowledge survey item with an overt affective self-assessment root such as “I can…” or “I am able to…” followed by a cognitive content outcome challenge. When explaining the knowledge survey to students, we focus their attention on the importance of these affective roots for when they rate their self-assessed competence and write their own items later.

We retain the original three-item response scale expressing relative competence as no competence, partial competence, and high competence. Research reveals three-item scales as valid and reliable as longer ones, but our attraction to the shorter scale remains because it promotes addressing KS items well. Once participants comprehend the meaning of the three items and realize that the choices are identical for every item, they can focus on each item and rate their authentic feeling about meeting the cognitive challenge without distraction by more complex response choices.

photo of woman facing a black board with the words "trust yourself"
Image by Gerd Altmann from Pixabay

We find the most crucial illumination for a student’s self-assessment dilemma: “How do I know when I can rate that I can do this well?” is “When I know that I can teach how to meet this challenge to another person.”

Backward design

We favor backward design to construct topical sections within a knowledge survey by starting with the primary concept students must master when finally understanding that topic. Then, we work backward to build successive items that support that understanding by constantly considering, “What do students need to know to address the item above?” and filling in the detail needed. Sometimes we do this down to the definitions of terms needed to address the preceding items.

Such building of more detail and structure than we sensed might be necessary, especially for introductory level undergraduates, is not “handing out the test questions in advance.” Instead, this KS structure uses examples to show that deceptively disconnected observations and facts allow understanding of the unifying meaning of  “concept” through reaching to make connections. Conceptual thinking enables transferability and creativity when habits of mind develop that dare to attempt to make “outrageous connections.”

The feeling of knowing and awareness of metadisciplinary learning

Students learn that convergent challenges that demand right versus wrong answers feel different from divergent challenges that require reasonable versus unreasonable responses. Consider learning “What is the composition of pyrite?” and “Calculate the area of a triangle of 50 meters in length and a base of 10 meters?” Then, contrast the feeling required to learn, “What is a concept?” or “What is science?”

The “What is science?” query is especially poignant. Teaching specialty content in units of courses and the courses’ accompanying college textbooks essentially bypass teaching the significant metadisciplinary ways of knowing of science, humanities, social science, technology, arts, and numeracy. Instructors like Matt Rowe design courses to overcome the bypassing and strive to focus on this crucial conceptual understanding (see video section at times 25.01 – 29.05).

Knowledge surveys written to overtly provoke metadisciplinary awareness aid in designing and delivering such courses. For example, ten metadisciplinary KS items for a 300-item general geology KS appeared at its start, two of which follow.

  1. I can describe the basic methods of science (methods of repeated experimentation, historical science, and modeling) and provide one example each of its application in geological science.
  2. I can provide two examples of testable hypotheses statements, and one example of an untestable hypothesis.

Students learned that they would develop the understanding needed to address the ten throughout the course. The presence of the items in the KS ensured that the instructor did not forget to support that understanding. For ideas about varied metadisciplinary outcomes, examine this poster.

Illuminating temporal qualities

Because knowledge surveys establish baseline data and collect detailed information through an entire course or program, they are practical tools from which students and instructors can gain an understanding of qualities they seldom consider. Temporal qualities include magnitudes (How great?), rates (How quickly?), duration (How long?), order (What sequence?), frequency (How often?), and patterns (What kind?).

More specifically, knowledge surveys reveal magnitude (How great were changes in learning?), rates (How quickly we cover material relative to how well we learned it?), duration (How long was needed to gain an understanding of specific content?), order (What learning should precede other learning?), and patterns (Does all understanding come slowly and gradually or does some come in time as punctuated “Aha moments?”).

Knowledge survey patterns reveal how easily we underestimate the effort needed to do the teaching that makes significant learning change. A typical pattern from item-by-item arrays of pre-post knowledge surveys reveals a high correlation. Instructors may find it challenging to produce the changes where troughs of pre-course knowledge surveys revealing areas of lowest confidence become peak areas in post-course knowledge surveys showing high confidence. Success requires attention to frequency (repetition with take-home drills), duration (extending assignments addressing difficult contents with more time), order (giving attention to optimizing sequences of learning material), and likely switching to more active learning modalities, including students authoring their own drills, quizzes, and KS items.

Studies in progress by author McKensie Phillips showed that students were more confident with the material at the end of the semester rather than each individual unit. This observation even held for early units where researchers expected confidence would decrease given the time elapsed between the end of the unit and when the student took the post-semester KS. The results indicate that certain knowledge mastery is cumulative, and students are intertwining material from unit to unit and practicing metacognition by re-engaging with the KS to deepen understanding over time.

Student-authored knowledge surveys

Introducing students to the KS authoring must start with a class knowledge survey authored by the instructor so that they have an example and disclosure of the kinds of thinking utilized to construct a KS. Author Chris Cogan routinely tasks teams of 4-5 students to summarize the content at the end of the hour (or week) by writing their own survey items for the content. Typically, this requires about 10 minutes at the end of class. The instructor compiles the student drafts, looks for potential misconceptions, and posts the edited summary version back to the class.

Beginners’ student-authored items often tend to be brief, too vague to answer, or too focused on the lowest Bloom levels. However, feedback from the instructor each week has an impact, and students become more able to write helpful survey items and – more importantly – better acquire knowledge from the class sessions. The authoring of items begins to improve thinking, self-assessment, and justified confidence.

Recalibrating for self-assessment accuracy

Students with large miscalibrations in self-assessment accuracy should wonder, “What can I do about this?” The pre-exam knowledge survey data enables some sophisticated post-exam reflection through exam wrappers (Lovett, 2013). With the responses to their pre-exam knowledge survey and the graded exam in hand, students can do a “deep dive” into the two artifacts to understand what they can do.

Instructors can coach students to gain awareness of what their KS responses indicate about their mastery of the content. If large discrepancies between the responses to the knowledge survey and the graded exam exist, instructors query for some introspection on how these arose. Did students use their KS results to inform their actions (e.g., additional study) before the exam? Did different topics or sections of the exam produce different degrees of miscalibration? Were there discrepancies in self-assessed accuracy by Bloom levels?

Most importantly, after conducting the exam wrapper analysis, students with significant miscalibration errors should each articulate doing one thing differently to improve performance. Reminding students to revisit their post-exam analysis well before the next exam is helpful. IwM editor Lauren Scharff noted that her knowledge surveys and tests reveal that most psychology students gradually improved their self-assessment accuracy across the semester and more consistently used them as an ongoing learning tool rather than just a last-minute knowledge check.

Takeaways

We construct and use surveys differently than when we began two decades ago. For readers, we provide a downloadable example of a contemporary knowledge survey that covers this guest-edited blog series and an active Google® Forms online version.

We have learned that mentoring for metacognition can measurably increase students’ self-assessment accuracy as it supports growing their knowledge, skills, and capacity for higher-order thinking. Knowledge surveys offer a powerful tool for instructors who aim to direct students toward understanding the meaning of becoming educated, becoming learning experts, and understanding themselves through metacognitive self-assessment. There remains much to learn.



Knowledge Surveys Part 1 — Benefits of Knowledge Surveys to Student Learning and Development

by Karl Wirth, Macalester College,
Ed Nuhfer, California State Universities (retired)
Christopher Cogan, Memorial University
McKensie Kay Phillips, University of Wyoming

Introduction

Knowledge surveys (KSs) present challenges like exam questions or assignments, but respondents do not answer these. Instead, they express their felt ability to address the challenges with present knowledge. Knowledge surveys focus on self-assessment, which is a special kind of metacognition. 

Overall, metacognition is a self-imposed internal dialogue that is a distinguishing feature of “expert learners” regardless of the discipline (e.g., Ertmer & Newby, 1996). Because all students do not begin college as equally aware and capable of thinking about their learning, instructors must direct students to keep them in constant contact with their metacognition. Paul Pintrich, a pioneer in metacognition, stressed that “instruction about metacognition must be explicit.” Knowledge surveys enable what Ertmer & Newby and Pintrich advocate in any class in any subject.

road sign with words "data" pointing to words "information" pointing to word "knowledge" with the word "learning above
Image by Gerd Altmann from Pixabay

Knowledge surveys began in 1992 during a conversation about annual reviews between the guest editor and a faculty member who stated: “They never ask about what I teach.” Upon hearing the faculty member, the guest editor decided to create a 200-item form to survey student ratings of their mastery of detailed content for his geology course at the start and end of the class. The items were simply an array of test and quiz questions, ordered in the sequence the students would encounter during the course. The students responded to each item through a 3-point response at the start and end of the course. 

The information from this first knowledge survey proved so valuable that the guest editor described this in 1996 in a geology journal as a formative assessment. As a result, geoscience faculty elsewhere started taking the lead in researching them and describing more benefits.

In 2003, U.S. Air Force Academy’s physics professor Delores Knipp and the guest editor published the first peer-reviewed paper (Nuhfer and Knipp, 2003) for multiple disciplines. If new to knowledge surveys, click the hotlink to that paper now and read at least the first page to gain a conceptual understanding of the instrument.

Self-assessment, Metacognition, and Knowledge Surveys

Becoming educated is a process of understanding self and the phenomena that one experiences. Knowledge surveys structure practices in understanding both. 

Our series’ earlier entries revealed the measurable influence of self-assessment on dispositions such as self-efficacy, mindset, and intellectual and ethical development that prove indispensable to the lifelong process of becoming educated. The entries on bias and privilege revealed that the privilege of having the kind of education that renders the unconscious conscious may determine the collective quality of a society and how well we treat one another within it.

Knowledge surveys prompt self-assessment reflections during learning every aspect of the content. Over a baccalaureate education, cumulative, repetitive practice can significantly improve understanding of one’s present knowledge and self-assessing accuracy.

Improving Learning

Knowledge surveys’ original purpose was to improve student learning (e.g., Nuhfer & Knipp, 2003Wirth et al., 20162021). Providing students with a knowledge survey at the beginning of a course or unit of instruction offered an interactive roadmap for an entire course that overtly disclosed the instructor’s intentions for learning to students. 

Early on, users recognized that knowledge surveys might offer a measure of changes in learning produced by a unit of instruction. Demonstrating the validity of such self-assessed competence measures was crucial but was finally achieved in 2016 and 2017.

Deeper Reading

Students quickly learned the value of prioritizing knowledge through engaging with the knowledge survey prior to and during engaging in reading. The structure of the KSs enabled reading with the purpose of illuminating known learning objectives. The structure also primed students to understand concepts by using the reading to clarify the connectedness between knowledge survey items.

Rather than just sitting down to “complete a reading,” students began reading assignments with appropriate goals and strategies; a characteristic of “expert readers” (Paris et al., 1996). When they encountered difficult concepts, they displayed increasing effort to improve their understanding of the topics identified as being essential to understand the concept. Further, knowledge surveys facilitated mentoring. When students did not understand the material, they proved more likely to follow up with a colleague or instructor to complete their understanding. 

Facilitating Acquiring Self-Regulation

Well-constructed knowledge surveys are detailed products of instructor planning and thinking. They communicate instructor priorities and coordinate the entire class to focus on specific material in unison. That students’ comments expressing they “didn’t know that would be on the exam” nearly disappeared from classroom conversations cannot be overly appreciated. 

Replacing scattered class-wide guessing of what to study allowed a collective focus on “How will we learn this material?” That reframing led to adopting learning strategies that expert learners employ when they have achieved self-regulation. Students increasingly consulted with each other or the instructor when they sensed or realized their current response to a knowledge survey item was probably inadequate. 

Levels and Degrees of Understanding

In preparing a knowledge survey for a course, the instructor carefully writes each survey item and learning objective so that learning addresses the desired mastery at the intended Bloom level (Krathwohl, 2002). Providing awareness of Bloom levels to students and reinforcing this throughout a course clarifies student awareness of the deep understanding required to teach the content at the required Bloom level to another person. Whereas it may be sufficient to remember or comprehend some content, demonstrating higher cognitive processes by having to explain to another how to apply, synthesize or evaluate central concepts and content of a course feels different because it is different. 

Knowledge surveys can address all Bloom levels and provide the practices needed to enable the paired understanding of knowing and “feeling of knowing” like no other instrument. Including the higher Bloom levels, combined with the explicitly stated advanced degree of understanding as the level of “teaching” or “explaining” to others, builds self-assessment skills and fosters the development of well–justified self-confidence. A student with such awareness can better focus efforts on extending the knowledge in which they recognize their weakness.

Building Skills with Feedback

The blog entries by Fleisher et al. in this series stressed the value of feedback in developing healthy self-assessments. Knowledge survey items that address the same learning outcomes as quizzes, exams, assignments, and projects promote instructional alignment. Such alignment allows explicit feedback from the demonstrated competence measures to calibrate the accuracy of self-assessments of understanding. Over time, knowledge surveys confer awareness that appropriate feedback builds both content mastery and better self-assessment skills.

A robust implementation directs students to complete the relevant portions of a knowledge survey after studying for an exam but before taking it. After the teacher grades the exams, students receive their self-assessed (knowledge survey score) and demonstrated (graded exam score) competence in a single package. From this information, the instructor can direct students to compare their two scores and to receive mentoring from the instructor when there is a large discrepancy (>10 points) between the two scores. 

Generally, a significant discrepancy from a single knowledge survey-exam pair comparison is not as meaningful as longer-term trends illuminated by cumulative data. Instructors who use KSs skillfully mentor students to become familiar with their trends and tendencies. When student knowledge survey responses consistently over- or under-estimate their mastery of the content, the paired data reveal this tendency to the student and instructor and open the opportunity for conversations about the student’s habitually favored learning strategies.

A variant implementation adds an easy opportunity for self-assessment feedback. Here, instructors assign students to estimate their score on an assignment or exam at the start of engaging the project and after completing the test or assignment prior to submission. These paired pre-post self-assessments help students to focus on their feelings of knowing and to further adjust toward greater self-assessment accuracy.

Takeaways

Knowledge surveys are unique in their utility for supporting student mastery of disciplinary knowledge, developing their affect toward accurate feelings of knowing, and improving their skills as expert learners. Extensive data show that instructors’ skillful construction of knowledge surveys as part of class design elicits deeper thinking and produces higher quality classes. After construction, class use facilitates mutual monitoring of progress and success by students and instructors. In addition to supporting student learning of disciplinary content, knowledge surveys keep students in constant contact with their metacognition and develop their capacity for lifelong learning. 

In Part 2, we follow from our more recent investigations on (1) more robust knowledge survey design, (2) learning about temporal qualities of becoming educated, (3) student authoring of knowledge surveys, and (4) mentoring students with large mis-calibrations in self-assessed competence toward greater self-assessment accuracy. 


Metacognition and Mindset for Growth and Success: Part 2 – Documenting Self-Assessment and Mindset as Connected

by Steven Fleisher, California State University
Michael Roberts, DePauw University
Michelle Mason, University of Wyoming
Lauren Scharff, U. S. Air Force Academy
Ed Nuhfer, Guest Editor, California State University (retired)

Self-assessment measures and categorizing mindset preference both employ self-reported metacognitive responses that produce noisy data. Interpreting noisy data poses difficulties and generates peer-reviewed papers with conflicting results. Some published peer-review works question the legitimacy and value of self-assessment and mindset.

Yeager and Dweck (2020) communicate frustration when other scholars deprecate mindset and claim it makes no difference under what mindset students pursue education. Indeed, that seems similar to arguing that enjoyment of education and students’ attitudes toward it makes no difference in the quality of their education.

We empathize with that frustration when we recall our own from seeing in class after class that our students were not “unskilled and unaware of it” and reporting those observations while a dominant consensus that “Students can’t self-assess” proliferated. The fallout that followed from our advocacy in our workplaces (mentioned in Part 2 of the entries on privilege) came with opinions that since “the empiricists have spoken,” there was no reason we should study self-assessment further. Nevertheless, we found good reason to do so. Some of our findings might serve as an analogy to demonstrating the value of mindsets despite the criticisms being leveled against them.

How self-assessment research became a study of mindset

In the summer of 2019, the guest editor and the first author of this entry taught two summer workshops on metacognition and learning at CSU Channel Islands to nearly 60 Bridge students about to begin their college experience. We employed a knowledge survey for the weeklong program, and the students also took the paired-measures Science Literacy Concept Inventory (SLCI). Students had the option of furnishing an email address if they wanted a feedback letter. About 20% declined feedback, and their mean score was 14 points lower (significant at the 99.9% confidence level) than those who requested feedback.

In revisiting our national database, we found that every campus revealed a similar significant split in performance. It mattered not whether the institution was open admissions or highly selective; the mean score of the majority who requested feedback (about 75%) was always significantly higher than those who declined feedback. We wondered if the responses served as an unconventional diagnosis of Dweck’s mindset preference.

Conventional mindset diagnosis employs a battery of agree-disagree queries to determine mindset inclination. Co-author Michael Roberts suggested we add a few mindset items on the SLCI, and Steven Fleisher selected three items from Dweck’s survey battery. After a few hundred student participants revealed only a marginal definitive relationship between mindset diagnosed by these items and SLCI scores, Steve increased our items to five.

Who operates in fixed, and who operates in growth mindsets?

The personal act of choosing to receive or avoid feedback to a concept inventory offers a delineator to classify mindset preference that differs from the usual method of doing so through a survey of agree-disagree queries. We compare here the mindset preferences of 1734 undergraduates from ten institutions using (a) feedback choice and (b) the five agree-disagree mindset survey items that are now part of Version 7.1a of the SLCI. That version has been in use for about two years.

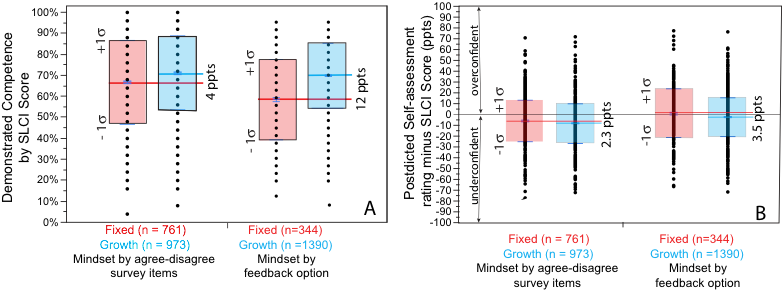
We start by comparing the two groups’ demonstrable competence measured by the SLCI. Both methods of sorting participants into fixed or growth mindset preferences confirmed a highly significant (99.9% confidence) greater cognitive competence in the growth mindset disposition (Figure 1A). As shown in the Figure, feedback choice created two groups of fixed and growth mindsets whose mean SLCI competency scores differed by 12 percentage points (ppts). In contrast, the agree-disagree survey items defined the two groups’ means as separated by only 4 ppts. However, the two methods split the student populace differently, with the feedback choice determining that about 20% of the students operated in the fixed mindset. In contrast, the agree-disagree items approach determined that nearly 50% were operating in that mindset.

We next compare the mean self-assessment accuracy of the two mindsets. In a graph, it is easy to compare mean skills between groups by comparing the scatter shown by one standard deviation (1 Sigma) above and below the means of each group (Figure 1B). The group members’ scatter in overestimating or underestimating their actual scores reveals a group’s developed capacity for self-assessment accuracy. Groups of novices show a larger scatter in their group’s miscalibrations than do groups of those with better self-assessment skills (see Figure 3 of resource at this link).

Graphs showing how fixed and growth mindsets relate to SLCI scores, differing based on how mindset is categorized.

Figure 1. A. Comparisons of competence (SLCI scores) of 1734 undergraduates between growth mindset participants (color-coded blue) and fixed mindset participants (color-coded red) mindsets as deduced by two methods: (left) agree-disagree survey items and (right) acceptance or opting-out or receiving feedback. “B” displays the measures of demonstrated competence spreads of one standard deviation (1 Sigma) in growth (blue) and fixed mindset (red) groups as deduced by the two methods. The thin black line at 0 marks a perfect self-assessment rating of 0, above which lie overconfident estimates and below which lie underconfident estimates in miscalibrations of self-assessed accuracy. The smaller the standard deviation revealed by the height of the rectangles in 2B, the better the group’s ability to self-assess accurately. Differences shown in A of 4 and 12 ppts and B of 2.3 and 3.5 ppts are differences between means.

On average, students classified as operating in a growth mindset have better-calibrated self-assessment skills (less spread of over- and underconfidence) than those operating in a fixed mindset by either classification method (Figure 1B). However, the difference between fixed and growth was greater and more statistically significant when mindset was classified by feedback choice (99% confidence) rather than by the agree-disagree questions (95% confidence).

Overall, Figure 1 supports Dweck and others advocating for the value of a growth mindset as an asset to learning. We urge contextual awareness by referring readers to Figure 1 of Part 1 of this two-part thematic blog on self-assessment and mindset. We have demonstrated that choosing to receive or decline feedback is a powerful indicator of cognitive competence and at least a moderate indicator of metacognitive self-assessment skills. Still, classifying people into mindset categories by feedback choice addresses only one of the four tendencies of mindset shown in that Figure. Nevertheless, employing a more focused delineator of mindset preference (e.g., choice of feedback) may help to resolve the contradictory findings reported between mindset type and learning achievement.

At this point, we have developed the connections between self-assessment, mindset, and feedback we believe are most valuable to the readers of the IwM blog. Going deeper is primarily of value to those researching mindset. For them, we include an online link to an Appendix to this Part 2 after the References, and the guest editor offers access to SLCI Version 7.1a to researchers who would like to use it in parallel with their investigations.

Takeaways and future direction

Studies of self-assessment and mindset inform one another. The discovery of one’s mindset and gaining self-assessment accuracy require knowing self, and knowing self requires metacognitive reflection. Content learning provides the opportunity for developing the understanding of self by practicing for self-assessment accuracy and acquiring the feeling of knowing while struggling to master the content. Learning content without using it to know self squanders immense opportunities.

The authors of this entry have nearly completed a separate stand-alone article for a follow-up in IwM that focuses on using metacognitive reflection by instructors and students to develop a growth mindset.

References

Dweck, C. S. (2006). Mindset: The new psychology of success. New York: Random House.

Hattie, J., & Timperley, H. (2007). The power of feedback. Review of Educational Research, 77(1), 81–112. https://doi.org/10.3102/003465430298487


Metacognition and Mindset for Growth and Success: APPENDIX to Part 2 – Documenting Self-Assessment and Mindset as Connected

by Ed Nuhfer, Guest Editor, California State University (retired)
Steven Fleisher, California State University
Michael Roberts, DePauw University
Michelle Mason, University of Wyoming
Lauren Scharff, U. S. Air Force Academy
Ed Nuhfer, Guest Editor, California State University (retired)

This Appendix stresses numeracy and employs a dataset of 1734 participants from ten institutions to produce measures of cognitive competence, self-assessed competence, self-assessment accuracy, and mindset categorization. The database is sufficient to address essential issues introduced in our blogs.

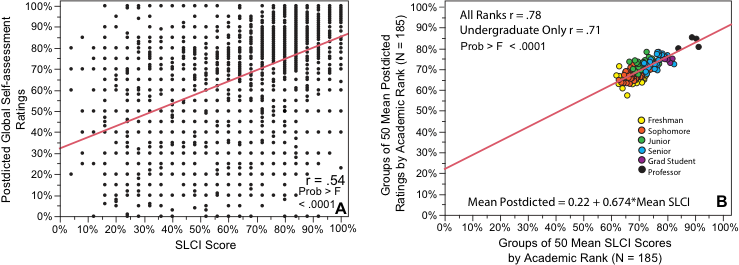
Finding replicable relationships in noisy data employs groups from a database collected from instruments proven to produce high-reliability measures. (See Figure 10 at this link.). If we assemble groups, say, groups of 50, as shown in Figure 1 B, we can attenuate the random noise in individuals’ responses (Fig. 1A) and produce a clearer picture of the signal hidden within the noise (Fig. 1B).

graphs showing postdicted self-assessment and SLCI a) individual data and b) group data

Figure 1 Raw data person-by-person on over 9800 participants (Fig. 1 A) shows a highly significant correlation between measures of actual competence from SLCI scores and postdicted self-assessed competence ratings. Aggregating the data into over 180 groups of 50 (Fig. 1 B) reduces random noise and clarifies the relationship.

Random noise is not simply an inconvenience. In certain graphic types, random noise generates patterns that do not intuitively appear random. Researchers easily interpret these noise patterns as products of a human behavior signal. The “Dunning-Kruger effect” appears built on many researchers doing that for over twenty years. 

Preventing confusing noise with signal requires knowing what randomness looks like. Researchers can achieve this by ensuring that the surveys and test instruments used in any behavioral science study have high reliability and then constructing a simulated dataset by completing these instruments with random number responses. The simulated population should equal that of the participants in the research study, and graphing the simulated study should employ the same graphics researchers intend to present the participants’ data in a publication.

The 1734 participants addressed in Parts 1 and 2 of this blog’s theme pair on mindset are part of the larger dataset represented in Figure 1. The number is smaller than 9800 because we only recently added mindset questions. 

The blog containing this Appendix link showed the two methods of classifying mindset as consistent in designating growth mindset as associated with higher scores on cognitive measures and more accurate self-assessments. However, this finding does not directly test how the two classification methods are related to one another. The fact noted in the blog that the two methods classified people differently indicated a reason to anticipate that the two may not prove to be directly statistically related.

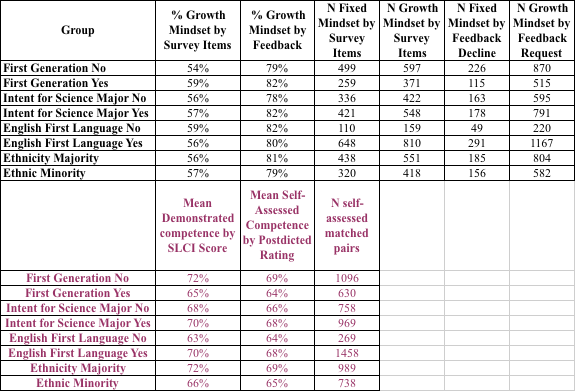
We need to employ groups to attenuate noise, and ideally, we want large groups with good prospects of a spread of values. We first picked the groups associated with furnishing information about privilege (Table 1) because these are groups large enough to attenuate random noise. Further, the groups displayed highly significant statistical spreads when we looked at self-assessed and demonstrable competence within these categories. Note well: we are not trying to study privilege aspects here. Our objective, for now, is to understand the relationship between mindset defined by agree-disagree items and mindset defined by requests for feedback.

We have aggregated our data in Table 1 from four parameters to yield eight paired measures and are ready to test for relationships. Because we already know the relationship between self-assessed competence and demonstrated competence, we can verify whether our existing dataset of 1734 participants presented in 8 paired measures groups is sufficient to deduce the relationship we already know. Looking at self-assessment serves as a calibration to help answer, “How good is our dataset likely going to be for distinguishing the unknown relationships we seek about mindset?”

Mindset and self-assessment indicators by large groups.

Table 1. Mindset and self-assessment indicators by large groups. The table reveals each group’s mindset composition derived from both survey items and feedback and the populace size of each group.

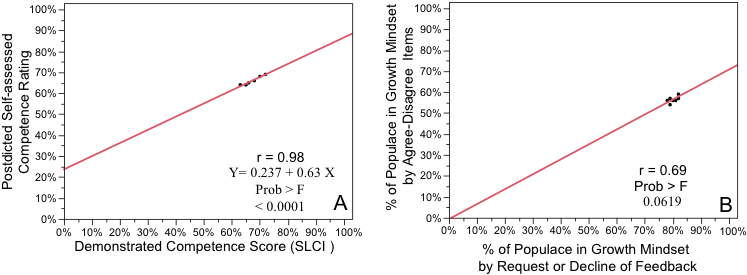
Figure 2 shows that our dataset in Table 1 proved adequate in capturing the known significant relationship between self-assessed competence and demonstrated competence (Fig. 2A). The fit-line slope and intercept in Figure 2A reproduce the relationship established from much larger amounts of data (Fig. 1 B). However, the dataset did not confirm a significant relationship between the results generated by the two methods of categorizing people into mindsets (Fig. 2B).

In Figure 2B, there is little spread. The plotted points and the correlation are close to significant. Nevertheless, the spread clustered so tightly that we are apprehensive that the linear relationship would replicate in a future study of a different populace. Because we chose categories with a large populace and large spreads, more data entered into these categories probably would not change the relationships in Figure 2A or 2B. More data might bump the correlation in Figure 2B into significance. However, this could be more a consequence of the spread of the categories chosen for Table 1 than a product of a tight direct relationship between the two methods employed to categorize mindset. However, we can resolve this by doing something analogous to producing the graph in Figure 1B above.

Relationships between self-assessed competence and demonstrated competence (A) and growth mindset diagnosed by survey items and requests for feedback (B). The data graphed is from Table 1.

Figure 2. Relationships between self-assessed competence and demonstrated competence (A) and growth mindset diagnosed by survey items and requests for feedback (B). The data graphed is from Table 1.

We next place the same participants from Table 1 into different groups and thereby remove the spread advantages conferred by the groups in Table 1. We randomize the participants to get a good mix of the populace from the ten schools, sort the randomized data by class rank to be consistent with the process used to produce Figure 1B and aggregate them into groups of 100 (Table 2).

Table 2. 1700 students are randomized into groups of 100, and the means are shown for four categories for each group.

Table 2. 1700 students are randomized into groups of 100, and the means are shown for four categories for each group.

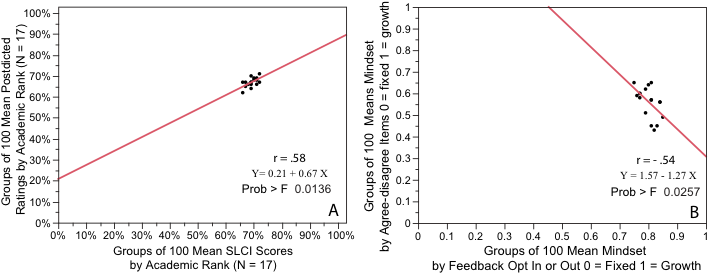
The results employing different participant groupings appear in Figure 3. Figure 3A confirms that the different groupings in Table 2 attenuate the spread introduced by the groups in Table 1.

Figure 3. The data graphed is from Table 2. Relationships between self-assessed competence and demonstrated competence appear in (A). In (B), plotting classified by agree-disagree survey items versus mindset classified by requesting or opting out of feedback fails to replicate the pattern shown in Figure 2 B

Figure 3. The data graphed is from Table 2. Relationships between self-assessed competence and demonstrated competence appear in (A). In (B), plotting classified by agree-disagree survey items versus mindset classified by requesting or opting out of feedback fails to replicate the pattern shown in Figure 2 B

The matched pairs of self-assessed competence and demonstrable competence continue in Figure 3A to reproduce a consistent line-fit that despite diminished correlation that still attains significance like Figures 1B and 2A. 

In contrast, the ability to show replication between the two methods for categorizing mindsets has completely broken down. Figure 2B shows a very different relationship from that displayed in 1B. Deducing the direct relationship between the two methods of categorizing mindset proves not replicable across different groups.

To allow readers who may wish to try different groupings, we have provided the raw dataset used for this Appendix that can be downloaded from https://profcamp.tripod.com/iwmmindsetblogdata.xls.

Takeaways

The two methods of categorizing mindset, in general, designate growth mindset as associated with higher scores on tests of cognitive competence and, to a lesser extent, better self-assessment accuracy. However, the two methods do not show a direct relationship with each other. This indicates the two are addressing different dimensions of the multidimensional character of “mindsets.”