by Steven Fleisher, Ph.D., California State University Channel Islands
Recently I had students in several of my classes take the Science Literacy Concept Inventory (SLCI) including self-assessment (Nuhfer, et al., 2017). Science literacy addresses one’s understanding of science as a way of knowing about the physical world. This science literacy instrument also includes self-assessment measures that run parallel with the actual competency measures. Self-assessment skills are some of the most important of the metacognitive competencies. Since metacognition involves “thinking about thinking,” the question soon becomes, “but thinking about what?”
Dunlosky and Metcalfe (2009) framed the processes of metacognition across metacognitive knowledge, monitoring, and control. Metacognitive knowledge involves understanding how learning works and how to improve it. Monitoring involves self-assessment of one’s understanding, and control then involves any needed self-regulation. Self-assessment sits at the heart of metacognitive processes since it sets up and facilitates an internal conversation in the learner, for example “Am I understanding this material at the level of competency needed for my upcoming challenge?” This type of monitoring then positions the learner for any needed control or self-regulation, for instance “Do I need a change my focus, or maybe my learning strategy?” Further, self-assessment is affective in nature and is central to how learning works. From a biological perspective, learning involves the building and stabilizing of cognitive as well as affective neural networks. In other words, we not only learn about “stuff”, but if we engage our metacognition (specifically self-assessment in this instance), we are enhancing our learning to include knowing about “self” in relation to knowing about the material.
This Improve with Metacognition posting provides information that was shared with my students to help them see the value of self-assessing and for understanding its relationship with their developing competencies and issues of privilege. Privilege here is defined by factors that influence (advantage or disadvantage) aggregate measures of competence and self-assessment accuracy (Watson, et al., 2019). Those factors involved: (a) whether students were first-generation college students, (b) whether they were non-native English-language students, and (c) whether they had an interest in science.
The figures and tables below result from an analysis of approximately 170 students from my classes. The narrative addresses the relevance of each of the images.
Figure 1 shows the correlation between students’ actual SLCI scores and their self-assessment scores using Knowledge Survey items for each of the SLCI items (KSSLCI). This figure was used to show students that their self-assessments were indeed related to their developing competencies. In Figure 2, students could see how their results on the individual SLCI and KSSLCI items were tracking even more closely than in Figure 1, indicating a fairly strong relationship between their self-assessment scores and actual scores.
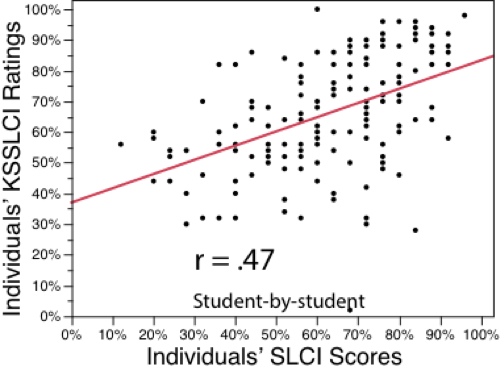
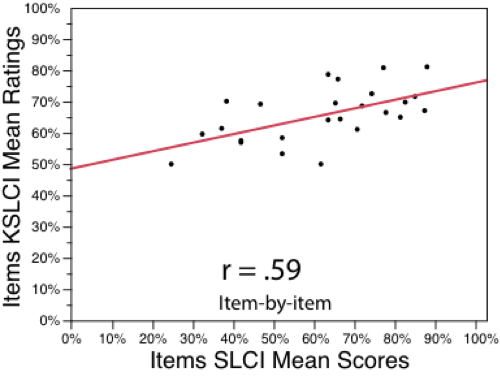
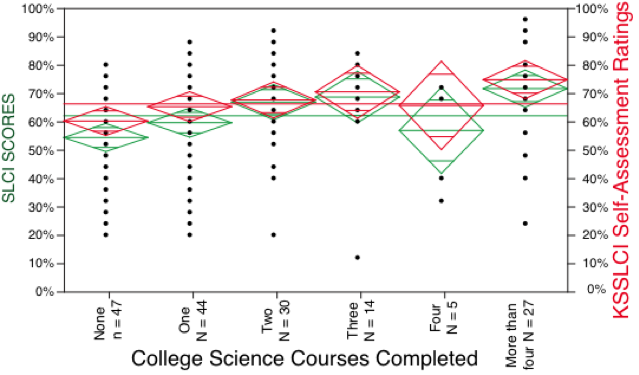
Figure 3 demonstrates the differences in science literacy scores and self-assessment scores among their different groups as defined by the number of science courses taken. Students could readily see the relationship between the number of science courses taken and improvement in science literacy. More importantly in this context, students could see that these groups had a significant sense of whether or not they knew the information, as indicated by the close overlapping of each pair of green and red diamonds. Students learn that larger numbers of participants can provide more confidence to where the true means actually lies. Also, I can show the meaning of variation differences within and between groups. In answering questions about how we know that more data would clarify relationships, I bring up an equivalent figure from our national database that shows the locations of the means within 99.9% confidence and the tight relationship between groups’ self-assessed competence and their demonstrated competence.
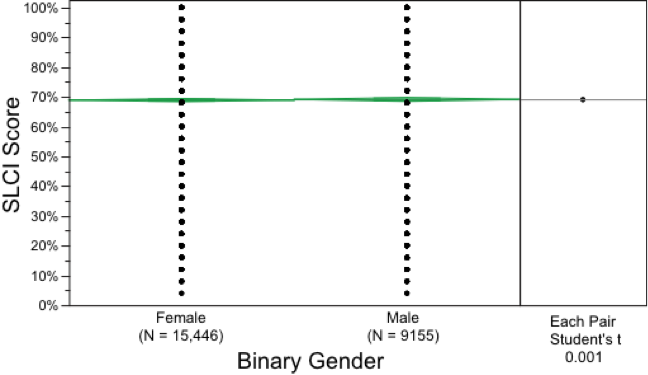
Regarding Figure 4, it is always fun to show students that there’s no significant difference between males and females in science literacy competency. This information comes from the SLCI national database and is based on over 24,000 participants.
It is then interesting to show students in that, in their smaller sample (Figure 5), there is a difference between the science literacy scores of males and females. The perplexed looks on their faces are then addressed by the additional demographic data in Table 1 below.
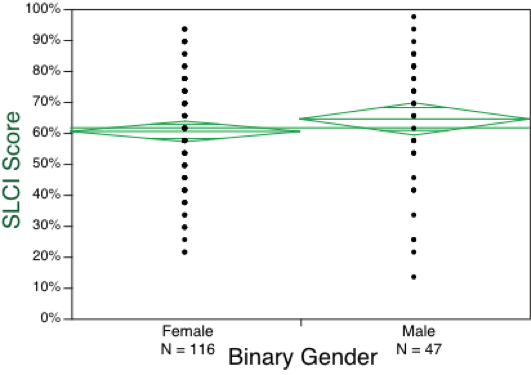
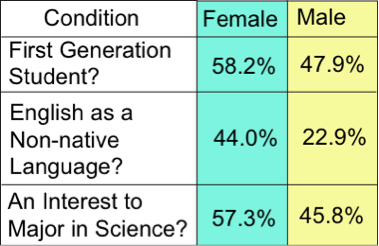
In Table 1, students could see that higher science literacy scores for males in their group were not due to gender, but rather, were due to significantly higher numbers of English as a non-native language for females. In other words, the women in their group were certainly not less intelligent, but had substantial, additional challenges on their plates.
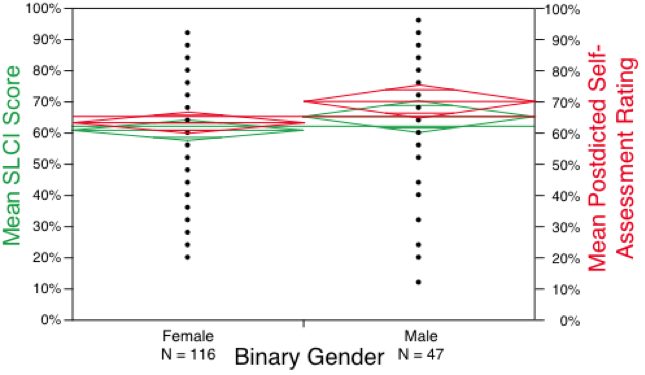
Students then become interested in discovering that the women demonstrated greater self-assessment accuracy than did the men, who tended to overestimate (Figure 6). I like to add here, “that’s why guys don’t ask for directions.” I can get away with saying that since I’m a guy. But more seriously, I point out that rather than simply saying women need to improve in their science learning, we might also want to help men improve in their self-assessment accuracy.
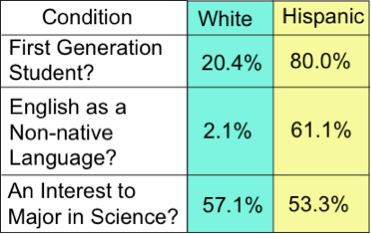
In Figure 7, students could see there was a strong difference in science literacy scores between Caucasians and Hispanics in my classes. The information in Table 2 below was then essential for them to see. Explaining this ethnicity difference offers a wonderful discussion opportunity for students to understand not only the data but what it reveals is going on with others inside their classrooms.
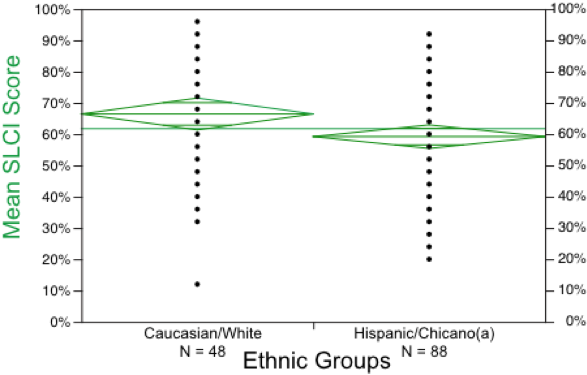
Table 2 showed that the higher science literacy scores in this sample were not simply due to ethnicity but were impacted by significantly greater numbers of first-generation students and English as a non-native language between groups. These students are not dumb but do not have the benefits in this context of having had a history of education speak in their homes and are navigating issues of English language learning.
When shown Figure 8, which includes self-assessment scores as well as SLCI scores, students were interested to see that both groups demonstrated fairly accurate self-assessment skills, but that Hispanics had even greater self-assessment accuracy than their Caucasian colleagues. Watson et. al (2019) noted that strong self-assessment accuracy for minority groups comes about from a need for being understandably cautious.
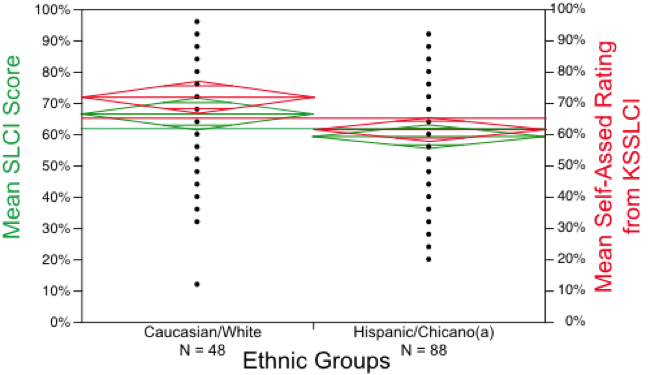
Figure 9 shows students that self-assessment is real. In seeing that most of their peers fall within an adequate range of self-assessment accuracy (between +/- 20 percentage points), students begin to see the value of putting effort into developing their own self-assessment skills. In general, results from this group of my students are similar to those we get from our larger national database (See our earlier blog post, Paired Self-Assessment—Competence Measures of Academic Ranks Offer a Unique Assessment of Education.)
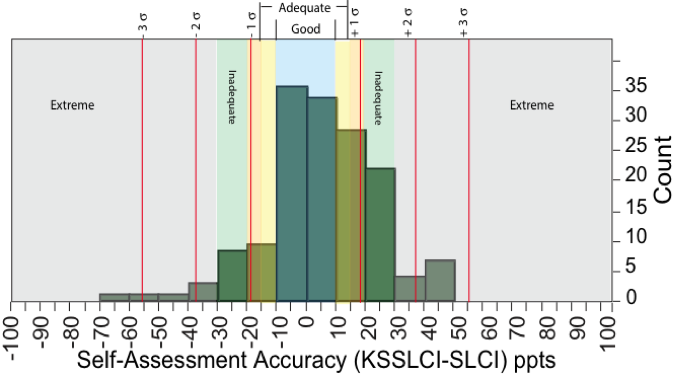
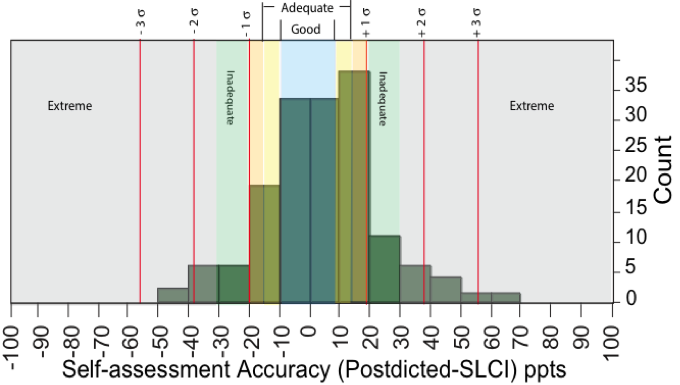
Figure 10 below gave me the opportunity to show students the relationship between their predicted item-by-item self-assessment scores (Figure 9) and their postdicted global self-assessment scores. Most of the scores fall between +/- 20 percentage points, indicating good to adequate self-assessment. In other words, once students know what a challenge involves, they are pretty good at self-assessing their competency.
In order to help students further develop their self-assessment skills and awareness, I encourage them to write down how they feel they did on tests and papers before turning them in (postdicted global self-assessment). Then they can compare their predictions with their actual results in order to fine-tune their internal self-assessment radars. I find that an excellent class discussion question is “Can students self-assess their competence?” Afterward, reviewing the above graphics and results becomes especially relevant. We also review self-assessment as a core metacognitive skill that ties to an understanding of learning and how to improve it, the development of self-efficacy, and how to monitor their developing competencies and control their cognitive strategies.
References
Dunlosky, J. & Metcalfe, J. (2009). Metacognition. Sage Publications Inc., Thousand Oaks, CA.
Nuhfer, E., Fleisher, S., Cogan, C., Wirth, K., & Gaze, E. (2017). How Random Noise and a Graphical Convention Subverted Behavioral Scientists’ Explanations of Self-Assessment Data: Numeracy Underlies Better Alternatives. Numeracy, Vol 10, Issue 1, Article 4. DOI: http://dx.doi.org/10.5038/1936-4660.10.1.4
Watson, R., Nuhfer, E., Nicholas Moon, K., Fleisher, S., Walter, P., Wirth, K., Cogan, C., Wangeline, A., & Gaze, E. (2019). Paired Measures of Competence and Confidence Illuminate Impacts of Privilege on College Students. Numeracy, Vol 12, Issue 2, Article 2. DOI: https://doi.org/10.5038/1936-4660.12.2.2