Micro-Metacognition Makes It Manageable

By Dr. Lauren Scharff, U. S. Air Force Academy *

For many of us, this time of year marks an academic semester’s end. It’s also intertwined with a major holiday season. There is so much going on – pulling our thoughts and actions in a dozen different directions. It almost seems impossible to be metacognitive about what we’re doing while we’re doing it: grading that last stack of exams or papers, finalizing grades, catching up on all those work items that have been on the back burner but need to get done before the semester ends. And that’s just a slice of our professional lives. Add in all the personal tasks and aspirations for these final few weeks of the year, and it’s Go, Go, Go until the day is over.

Well, that was a bit cathartic to get out, but also a bit depressing. Logically I know that by taking the time to reflect and use that awareness to help guide my behaviors (i.e. engage in metacognition), I will feel energized and revitalized because I’ll have a plan with a good foundation. I will more likely be successful in whatever it is I’m hoping to accomplish, especially if I regularly take the time to reflect and fine tune my efforts. But the challenge is, how do I fit it all in?

My proposed solution is micro-metacognition!

So, what do I mean by that? I think micro-metacognition is analogous to taking the stairs whenever you can rather than signing up for a new gym membership. Stairs are readily available at no cost and can be used spur-of-the-moment. In comparison, the gym membership requires a more concerted effort and larger chunks of time to get to the facility, work out, clean up and head home. In the more academic realm, micro metacognition falls in line with the spirit of James Lang’s (2016) Small Teaching recommendations. He advocates for the powerful impact of even small changes in our teaching (e.g. how we use the first 5 minutes of class). In other words, we don’t have to completely redesign a course or our way of teaching to see large benefits.

To help place micro-metacognition into context, I will borrow a framework from Poole and Simmons (2013), who suggested a “4M” model for conceptualizing the level of impact of SoTL work: micro (individual/classroom), meso (department/ program), macro (institutional), and mega (beyond a single institution). In this case though, we’re looking at engagement in metacognitive practices, so the entity or level of focus will always be the individual, and the scale will refer to the amount of planning, effort, and time needed for the metacognitive practice. This post focuses on instructors being metacognitive about their practice of teaching, but I believe that parallels can easily be made for students’ engagement in metacognition as they are learning.  

The 4M Metacognition Framework

Micro-metacognition – Use of isolated, low-cost tactics to promote metacognitive instruction when engaged in single tasks (e.g. grading a specific assignment – see below for fleshed out example). These can be used without investments in advance planning.

Meso-metacognition – Use of tactics to promote metacognitive instruction throughout an individual lesson or when incorporating a specific type of activity (e.g. discussion or small group work) across multiple lessons. These tactics have been given more forethought with respect to integration with lesson / activity objectives.  

Macro-metacognition – Use of more regular tactics to promote metacognitive instruction across an entire course / semester. Planning for these would be more long-term and closely integrated with learning objectives for the course or with professional development goals of the instructor.  (For an example of this level of effort, see Use of a Guided Journal to Support Development of Metacognitive Instructors.)

Mega-metacognition – Use of tactics to promote metacognitive instruction across an instructor’s entire set of courses and professional activities (and beyond). At this level of engagement, metacognition will likely be a “way of doing things” for the instructor, but each new engagement will still require conscious effort and planning to support goals and objectives.

An Example of Micro Metacognition

Micro-metacognition  efforts are not pre-planned when the instructional task is planned; they are added later as the idea crosses the instructor’s mind and opportunity arises.

For example, when I am about to start grading a specific group of papers, I might reflect that in addition to the formally-stated learning objectives that will be assessed on the rubric, I want to support growth mindset in my students for their future writing efforts. This additional goal could come about from a recent reading on mindset or discussion with my colleagues. I know that I would be likely to forget this goal when I’m focused on the other rubric aspects of the grading. So, I write that goal on a stickie note and put it where I am likely to see it when grading. Then, when I am grading, I have an easy-to-implement awareness aide to add comments in the papers that might specifically support my students’ growth mindset.

Image showing an office with a sticky note stuck to the corner of a computer screen. The note says "Promote Growth Mindset -- encourage exploration of new ideas & connections"

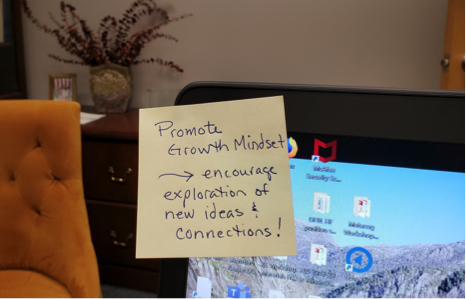
In sum:  easily implemented stickie note –> promotes awareness of goal –> self-regulation of desired grading behavior on that specific instructional task == Micro-metacognitive Instruction!

I can think of lots of other ways instructors might incorporate micro-metacognition in their instructional endeavors, from the proverbial string tied to one’s finger, to pop-up calendar prompts, to asking a student for a reminder to attend to questions when we get to a particular topic.  Or, awareness might come without an intentional prompt. The key is to then use that awareness to self-regulate some aspect of our instructional behavior in support of student learning and development. The opportunities are endless!

I hope you are motivated as you enter the new year. Happy holidays!

——————-

Lang, J. M. (2016). Small teaching: Everyday lessons from the science of learning.

Poole, G., & Simmons, N. (2013). The contributions of the scholarship of teaching and learning to quality enhancement in Canada. In G. Gordon, & R. Land (Eds.). Quality enhancement in higher education: International perspectives (pp. 118-128). London: Routledge.

* Disclaimer: The views expressed in this document are those of the author and do not reflect the official policy or position of the U. S. Air Force, Department of Defense, or the U. S. Govt.


Metacognitive Self-Assessment, Competence and Privilege

by Steven Fleisher, Ph.D., California State University Channel Islands

Recently I had students in several of my classes take the Science Literacy Concept Inventory (SLCI) including self-assessment (Nuhfer, et al., 2017). Science literacy addresses one’s understanding of science as a way of knowing about the physical world. This science literacy instrument also includes self-assessment measures that run parallel with the actual competency measures. Self-assessment skills are some of the most important of the metacognitive competencies. Since metacognition involves “thinking about thinking,” the question soon becomes, “but thinking about what?”

Dunlosky and Metcalfe (2009) framed the processes of metacognition across metacognitive knowledge, monitoring, and control. Metacognitive knowledge involves understanding how learning works and how to improve it. Monitoring involves self-assessment of one’s understanding, and control then involves any needed self-regulation. Self-assessment sits at the heart of metacognitive processes since it sets up and facilitates an internal conversation in the learner, for example “Am I understanding this material at the level of competency needed for my upcoming challenge?” This type of monitoring then positions the learner for any needed control or self-regulation, for instance “Do I need a change my focus, or maybe my learning strategy?” Further, self-assessment is affective in nature and is central to how learning works. From a biological perspective, learning involves the building and stabilizing of cognitive as well as affective neural networks. In other words, we not only learn about “stuff”, but if we engage our metacognition (specifically self-assessment in this instance), we are enhancing our learning to include knowing about “self” in relation to knowing about the material.

This Improve with Metacognition posting provides information that was shared with my students to help them see the value of self-assessing and for understanding its relationship with their developing competencies and issues of privilege. Privilege here is defined by factors that influence (advantage or disadvantage) aggregate measures of competence and self-assessment accuracy (Watson, et al., 2019). Those factors involved: (a) whether students were first-generation college students, (b) whether they were non-native English-language students, and (c) whether they had an interest in science.

The figures and tables below result from an analysis of approximately 170 students from my classes. The narrative addresses the relevance of each of the images.

Figure 1 shows the correlation between students’ actual SLCI scores and their self-assessment scores using Knowledge Survey items for each of the SLCI items (KSSLCI). This figure was used to show students that their self-assessments were indeed related to their developing competencies. In Figure 2, students could see how their results on the individual SLCI and KSSLCI items were tracking even more closely than in Figure 1, indicating a fairly strong relationship between their self-assessment scores and actual scores.

scatterplot graph of knowledge survey compared to SCLI scores
Figure 1. Correlation with best-fit line between actual competence measures via a Science Literacy Concept Inventory or SLCI (abscissa) and self-assessed ratings of competence (ordinate) via a knowledge survey of the inventory (KSSLCI) wherein students rate their competence to answer each of the 25 items on the inventory prior to taking the actual test.
scatter plot of SCLI scores and knowledge survey scores by question
Figure 2. Correlation with best-fit line between the group of all my students’ mean competence measures on each item of the Science Literacy Concept Inventory (abscissa) and their self-assessed ratings of competence on each item of the knowledge survey of the inventory (KSSLCI).

Figure 3 demonstrates the differences in science literacy scores and self-assessment scores among their different groups as defined by the number of science courses taken. Students could readily see the relationship between the number of science courses taken and improvement in science literacy. More importantly in this context, students could see that these groups had a significant sense of whether or not they knew the information, as indicated by the close overlapping of each pair of green and red diamonds. Students learn that larger numbers of participants can provide more confidence to where the true means actually lies. Also, I can show the meaning of variation differences within and between groups. In answering questions about how we know that more data would clarify relationships, I bring up an equivalent figure from our national database that shows the locations of the means within 99.9% confidence and the tight relationship between groups’ self-assessed competence and their demonstrated competence.

categorical plot by number of college science courses completed
Figure 3. Categorical plot of my students in five class sections grouped by their self-identified categories of how many college-level science courses that they have actually completed. Revealed here are the groups’ mean SLCI scores and their mean self-assessed ratings. Height of the green (SLCI scores) and red (KSSLCI self-assessments) diamonds reveals with 95% confidence that the actual mean lies within these vertical bounds.

Regarding Figure 4, it is always fun to show students that there’s no significant difference between males and females in science literacy competency. This information comes from the SLCI national database and is based on over 24,000 participants.

categorical plot by binary gender
Figure 4. Categorical plot from our large national database by self-identified binary gender categories shows no significant difference by gender in competence of understanding science as a way of knowing.

It is then interesting to show students in that, in their smaller sample (Figure 5), there is a difference between the science literacy scores of males and females. The perplexed looks on their faces are then addressed by the additional demographic data in Table 1 below.

categorical plot by binary gender for individual class
Figure 5. Categorical plot of just my students by binary gender reveals a marginal difference between females and males, rather than the gender-neutral result shown in Fig. 4.

In Table 1, students could see that higher science literacy scores for males in their group were not due to gender, but rather, were due to significantly higher numbers of English as a non-native language for females. In other words, the women in their group were certainly not less intelligent, but had substantial, additional challenges on their plates.  

Table 1: percentages of male and female students as first generation, English and non-native speaker, and with respect to self-report interest to major in science

Students then become interested in discovering that the women demonstrated greater self-assessment accuracy than did the men, who tended to overestimate (Figure 6). I like to add here, “that’s why guys don’t ask for directions.” I can get away with saying that since I’m a guy. But more seriously, I point out that rather than simply saying women need to improve in their science learning, we might also want to help men improve in their self-assessment accuracy.   

categorical plot by gender including self-assessment data
Figure 6. The categorical plot of SLCI scores (green diamonds) shown in Fig. 5 now adds the self-assessment data (red diamonds) of females and males. The trait of females to more accurately self-assess that appears in our class sample is also shown in our national data. Even small samples taken from our classrooms can yield surprising information.

In Figure 7, students could see there was a strong difference in science literacy scores between Caucasians and Hispanics in my classes. The information in Table 2 below was then essential for them to see. Explaining this ethnicity difference offers a wonderful discussion opportunity for students to understand not only the data but what it reveals is going on with others inside their classrooms.

Figure 7. The categorical plot of SLCI scores by the two dominant ethnicities in my classroom. My campus is a Hispanic Serving Institution (HSI). The differences shown are statistically significant.

Table 2 showed that the higher science literacy scores in this sample were not simply due to ethnicity but were impacted by significantly greater numbers of first-generation students and English as a non-native language between groups. These students are not dumb but do not have the benefits in this context of having had a history of education speak in their homes and are navigating issues of English language learning. 

Table 2: percentage of white and hispanic students who report to be first generation students, English as non-native speakers, and interested in majoring in science.

When shown Figure 8, which includes self-assessment scores as well as SLCI scores, students were interested to see that both groups demonstrated fairly accurate self-assessment skills, but that Hispanics had even greater self-assessment accuracy than their Caucasian colleagues. Watson et. al (2019) noted that strong self-assessment accuracy for minority groups comes about from a need for being understandably cautious.

categorical plot by ethnicity and including self-assessment
Figure 8. The categorical plot of SLCI scores and self-assessed competence ratings for the two dominant ethnicities in my classroom. Groups’ collective feelings of competence, on average, are close to their actual competence. Explaining these results offered a wonderful discussion opportunity for students.

Figure 9 shows students that self-assessment is real. In seeing that most of their peers fall within an adequate range of self-assessment accuracy (between +/- 20 percentage points), students begin to see the value of putting effort into developing their own self-assessment skills. In general, results from this group of my students are similar to those we get from our larger national database (See our earlier blog post, Paired Self-Assessment—Competence Measures of Academic Ranks Offer a Unique Assessment of Education.)

distribution of self-assessment accuracy for individual course
Figure 9. The distribution of self-assessment accuracy of my students in percentage points (ppts) as measured by individuals’ differences between their self-assessed competence by knowledge survey and their actual competence on the Concept inventory.

Figure 10 below gave me the opportunity to show students the relationship between their predicted item-by-item self-assessment scores (Figure 9) and their postdicted global self-assessment scores. Most of the scores fall between +/- 20 percentage points, indicating good to adequate self-assessment. In other words, once students know what a challenge involves, they are pretty good at self-assessing their competency.

distribution of self-assessment accuracy for individual course after taking SCLI
Figure 10. The distribution of self-assessment accuracy of my students in percentage points (ppts) as measured by individuals’ differences between their postdicted ratings of competence after taking the SLCI and their actual scores of competence on the Inventory. In general, my students’ results are similar in self-assessment measured in both ways.

In order to help students further develop their self-assessment skills and awareness, I encourage them to write down how they feel they did on tests and papers before turning them in (postdicted global self-assessment). Then they can compare their predictions with their actual results in order to fine-tune their internal self-assessment radars. I find that an excellent class discussion question is “Can students self-assess their competence?” Afterward, reviewing the above graphics and results becomes especially relevant. We also review self-assessment as a core metacognitive skill that ties to an understanding of learning and how to improve it, the development of self-efficacy, and how to monitor their developing competencies and control their cognitive strategies.

References

Dunlosky, J. & Metcalfe, J. (2009). Metacognition. Sage Publications Inc., Thousand Oaks, CA.

Nuhfer, E., Fleisher, S., Cogan, C., Wirth, K., & Gaze, E. (2017). How Random Noise and a Graphical Convention Subverted Behavioral Scientists’ Explanations of Self-Assessment Data: Numeracy Underlies Better Alternatives. Numeracy, Vol 10, Issue 1, Article 4. DOI: http://dx.doi.org/10.5038/1936-4660.10.1.4

Watson, R., Nuhfer, E., Nicholas Moon, K., Fleisher, S., Walter, P., Wirth, K., Cogan, C., Wangeline, A., & Gaze, E. (2019). Paired Measures of Competence and Confidence Illuminate Impacts of Privilege on College Students. Numeracy, Vol 12, Issue 2, Article 2. DOI: https://doi.org/10.5038/1936-4660.12.2.2