by Dr. Ed Nuhfer, California State Universities (retired)
Since 2002, I’ve built my “Developers’ Diary” columns for National Teaching and Learning Forum (NTLF) around the theme of fractals and six essential components in practice of college teaching: (1) affect, (2) levels of thinking (intellectual & ethical development), (3) metacognition. (4) content knowledge & skills, (5) pedagogy and (6) assessment. The first three focus on the internal development of the learner and the last three focus on the knowledge being learned. All six have interconnections through being part of the same complex neural networks employed in practice.
In past blogs, we noted that affect and metacognition, until recently, were deprecated and maligned by behavioral scientists, with the most deprecated aspect of metacognition being self-assessment. The highest levels of thinking discovered by Perry are heavily affective and metacognitive, so some later developmental models shunned these stages when only cognition seemed relevant to education. However, the fractal model advocates for practicing through drawing on all six components. Thus, metacognition is not merely important for its own merits; we instructors rely on metacognitive reflection to monitor whether we are facilitating students’ learning through attending to all six.
The most maligned components, affect and self-assessment may offer a key to measuring the overall quality of education and assessing progress toward highest levels of thinking. Such measurements have been something of a Grail quest for developers. To date, efforts to make such measures have proven to be labor intensive and expensive.
Measuring; What, Who, Why, and How?
The manifestation of affect in the highest Perry stages indicates that cognitive expertise and skills eventually connect to affective networks. At advanced levels of development, experts’ affective feelings are informed feelings that lead to rapid decisions for action that are usually effective. In contrast, novices’ feelings are not informed. Beginners’ approaches are tentative and take a trial-and-error approach rather than an efficient path to a solution. By measuring how well students’ affective feelings of their self-assessed competence have integrated with their cognitive expertise, we should be able to assess their stage of progress toward high-level thinking.
To assess a group’s (a class, class rank or demographic category) state of development, we can obtain the group’s mean self -assessments of competence on an item-by-item basis from a valid, reliable multiple-choice test that requires some conceptual thinking. We have such a test in the 25-item Science Literacy Concept Inventory (SLCI). We can construct a knowledge survey of this Inventory (KSSLCI) to give us 25 item-by-item self-assessed estimates of competence from each participant.
As demonstrated in 2016 and 2017, item-by-item averages of group responses attenuate the random noise present in individuals’ responses. Thus, assessments done by using aggregate information from groups can provide a clear self-assessment signal that allows us to see valid differences between groups.
If affective self-assessed estimates become increasingly informed as higher level thinking capacity develops, then we should see that the aggregate item-by item paired measures correlate with increasing strength as groups gain in participants who possess higher order thinking skill. We can indeed see this trend.
Picture the Results
For clear understanding, it is useful first to see what graphs of paired measures of random noise (meaningless nonsense) look like (Figure 1A) and how paired measures look when they correlate perfectly (Figure 1B). We produce these graphs by inputting simulated data into our SLCI and KSSLCI instruments (Figure 1).
Random nonsense produces a nearly horizontal line along the mean (“regression to the mean”) of 400 random simulated responses to each of the 25 items on both instruments. The best-fit line has values of nearly zero for both correlation (r) and line slope (Figure 1A).
We use a simulated set of data twice to get the pattern of perfect correlation when the participants’ mean SLCI and KSSLCI scores for each item are identical. The best-fit line (Figure 1B has a correlation (r) and a line slope, both of about unity (1). The patterns from actual data (Figure 2) will show slopes and correlations between random noise and perfect order.
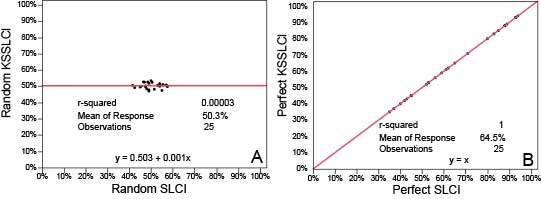
Figure 1. Modeling correlational patterns with simulated responses to a measure of competence (SLCI) and a measure of self-assessed competence (KSSLCI). A shows correlational pattern if responses are random noise. B shows the pattern if 400 simulated participants perfectly assessed their competence.
Next, we look at the actual data obtained from 768 novices (freshmen and sophomores—Figure 2 A). Novices’ self-assessed competence and actual competence have a significant positive correlation. The slope is 0.319 and r is .69. The self-assessment measures explain about half of the variance (r2) in SLCI scores. Even novices do not appear to be “unskilled and unaware of it.” Developing experts (juniors, seniors and graduate students, N = 831 in Figure 2B) produce a fit line with a slightly steeper slope of 0.326 and a stronger r of .77. Here, the self-assessment measures explain about 60% of the variance in the Inventory scores.
When we examine experts (109 professors in Figure 2C), the fit line steepens to a slope of 0.472, and a correlation of r = .83 explains nearly 70% of the variance in Inventory scores. The trend from novice to expert is clear.
Final Figure 2D shows the summative mean SLCI scores and KSSLCI ratings for the four undergraduate ranks plus graduate students and professors. The values of KSSLCI/SLCI increase in the order of academic rank. The correlation (r) between the paired measures is close to unity, and the slope of 0.87 produces a pattern very close to that of perfect self-assessment (Figure 1B).
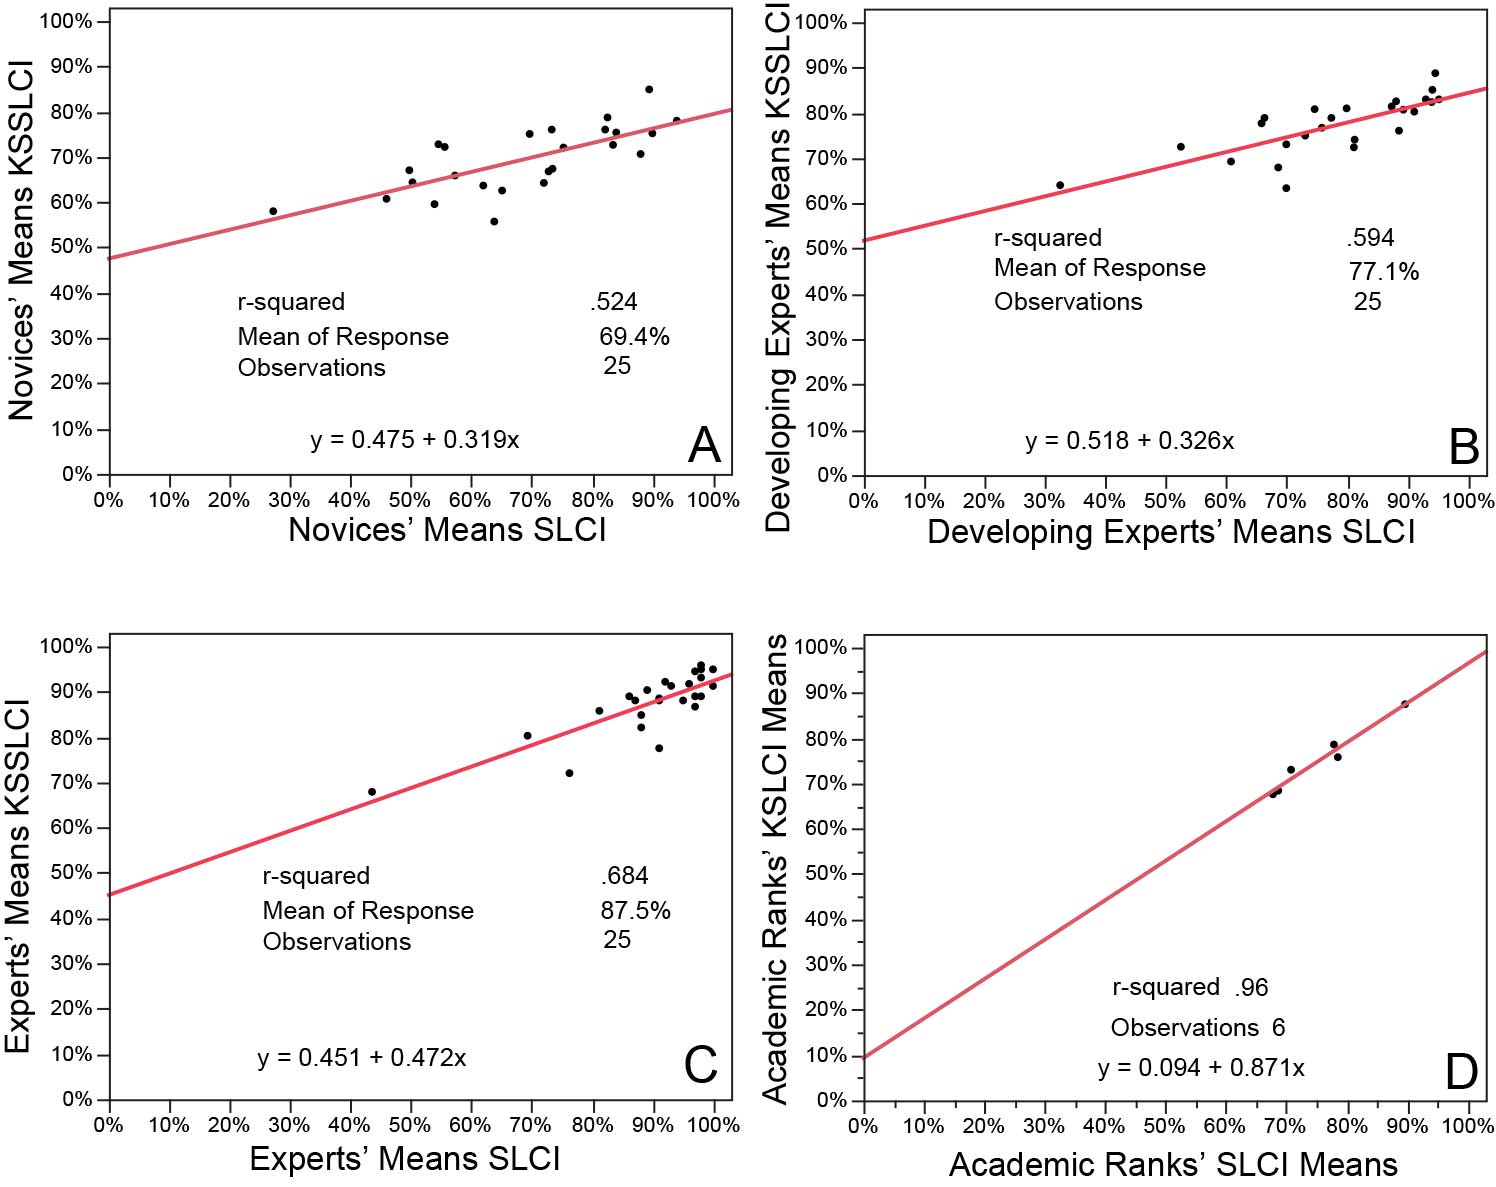
Figure 2: Correlations from novice to expert of item-by-item group means of each of the 25 items addressed on the KSSLCI and the SLCI. Panel A contains the data from 768 novices (freshmen and sophomores). B consists of 831 developing experts (juniors, seniors and graduate students). C comes from 109 experts (professors). Panel D employs all participants and plots the means of paired data by academic rank. We filtered out random guessing by eliminating data from participants with SLCI scores of 32% and lower.
Figure 2 supports: that self-assessments are not random noise, that knowledge surveys reflect actual competence; that affective development occurs with cognitive development, and that a group’s ability to accurately self-assess seems indicative of the group’s general state of intellectual development.
Where might your students might fall on the continuum of measures illustrated above? By using the same instruments we employ, your students can get measures of their science literacy and self-assessment accuracy, and you can get an estimate of your class’s present state of intellectual development. The work that led to this blog is under IRB oversight, and getting these measures is free. Contact enuhfer@earthlink.net for further information.